Analysing jogging runs
- Aug. 17, 2019
| Example files with this article: | |
Introduction
Nowadays there are a lot of apps and websites to assist us with day-to-day activities. Think about cooking, sports, games, etc. Of course I have no objections against these apps, but I prefer to build muy own custom tools :-) And afterwards I publish these on my website for the general public.
The attached Excel file allows you to follow up on your jogging runs. We are talking about the total time run, split times, average speed, comparing runs against each other, and much more. The workbook assumes miles, seconds and mile/hour as the main measurement units, but if you want different calculations I will glady refer you to my recent article on converting.
Yet another article from the past but it relates to fitness schemes: read it here.
The workbook was made for a run of about 6.5 miles with 10 stops and the finish. Stops do not need to be located at equal distances, you can pick the locations by yourself. Below you can find the input of split times, please use the same notation for minutes and seconds.

We can see:
- the run date (not a formula, just input of a real date instead of text)
- the split times when the points were reached, hence it's not the time needed to cover the distance from one point to the next
- a column for input of remarks about the run
Next to that you also track the possibility to gather information by point (stop along the way). Amongst other things, the distances between adjacent stops, the location of the stops (such that any time measurement can be precise and equal for all runs). I measured the distances using a Dutch website: afstandmeten.nl so you might probably need to search for your own data. The red triangles depict the comments in Excel where additional (textual) information is stored.

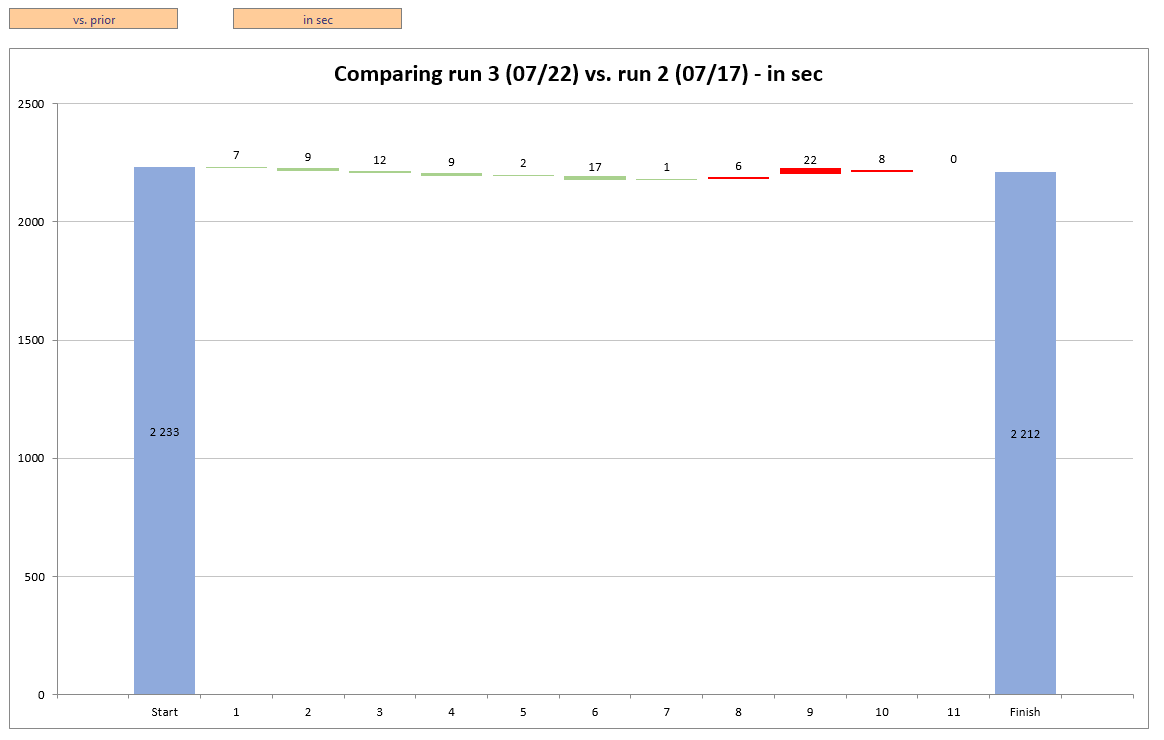
After correct input of the data, you can use the workbook for your own analyses. Different runs are calculated and can be compared against each other. The main comparisons are those where we compare a run against the prior run, or against the average of runs. The average run is defined as the arithmetic average of each of the intervals/stops. To me, these comparisons seem to make the most sense. You can compare the runs in tabular format with numbers and statistics, or with charts such that evolutions are visible in a blink of an eye.

Using conditional formatting, we can show any progression in green, and any retrogression will be red. You can also indicate whether the chosen run (number) is part of the average of runs or not. I found it an interesting feature, both intellectually and for comparisons, though in practice the differences are likely to be small.
The waterfall chart on the second worksheet is another eye catcher. Make sure to have a look at it too because it will grealy simplify your analyses!

Oh, the file is not capable of counting the calories burnt during jogging sessions, nor the weight loss. For that you still need an app or whip up your own workbook ;-)
