TM1 Message log analysis with Power Query
- Jul. 2, 2017
| Example files with this article: | |
Introduction
It has been a month since I posted an article on my website, time to write a new one! Here is an article showing off a technique that is quite interesting. We will see how to massage data (coming in from a text file) using Power Query. This will be illustrated using the TM1 Message log.
So, let me describe the topic of this article: we would like to go through the lines of the TM1 message log and retrieve meaningful information. The message log is usually quite a large file. It contains, depending on the level of detail that one needs/desires, hundreds of thousands of lines regarding the activity in the TM1 model. Executing processes or chores, changing a dimension, users logging in and out, model dependencies, … a lot of information can be found in the message log.
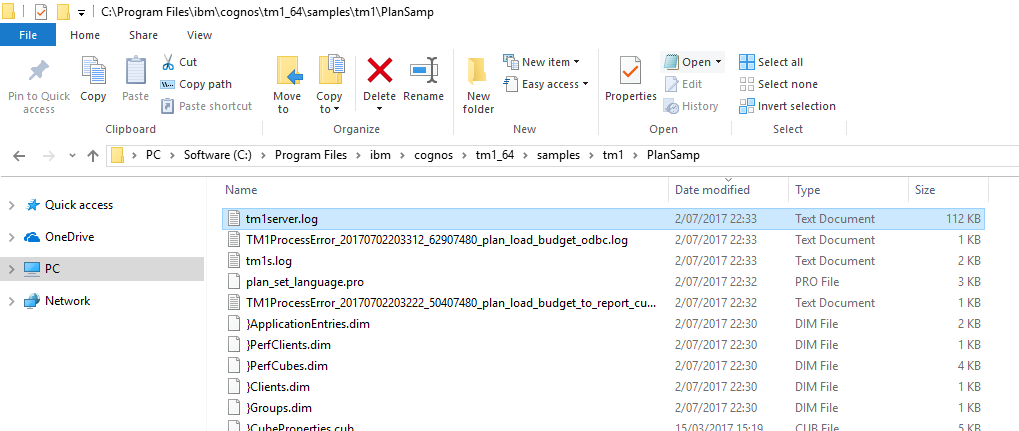
The message log is nothing more than an (albeit very simple) interface on a text file. The file is called tm1server.log and it can be found in the TM1 logging directory. An example for the Planning sample TM1 model goes like this:
Power Query
We will use Excel 2016 where Power Query is the standard tool to import and manipulate external data. However, Power Query does this in such a way, that you can "record" the steps (importing, manipulating, ...). You can easily refresh the results of your steps, much like refreshing a pivot table. This means that there is a connection to the data source (in our case the text file of the message log). The output of our work will be stored in a Table (ListObject). That table can be refreshed when the message log changes. All the manipulations that we define will be automatically applied to the text file and the output in the table is updated. This removes the need to write a couple of hundreds of lines of VBA-code. Power Query has its own programming language if you like to do so, it's called M. The steps that we can record, produce M code. We can look at the code and adapt, should it be necessary.
Below I present you an Excel file to look at the message log contents without going through the hassle of text file analysis (Notepad++ or similar). After that I will explain the steps to get there too. As always, you can freely download my files from the top of the page.
Excel application
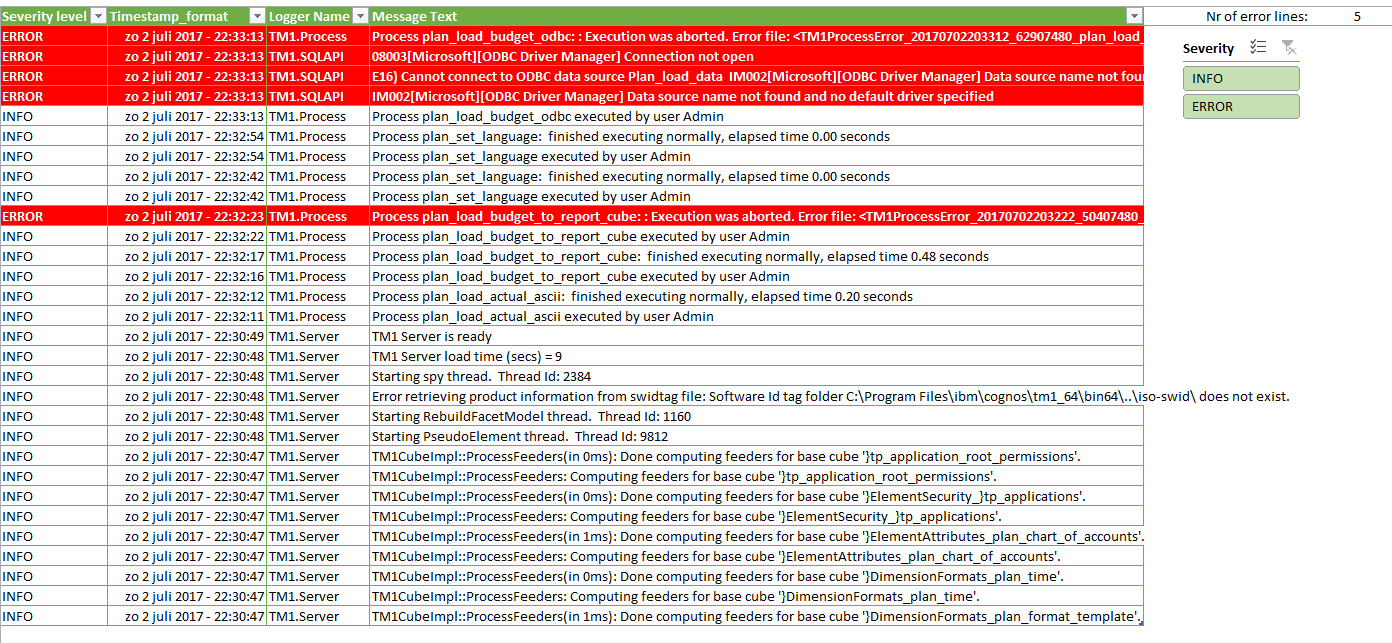
What you see is the message log for the TM1 Planning sample. I loaded the model and then I executed a couple of processes, also purposefully generating some errors such that we have some ERROR lines in the message log. They are formatted in white/red with conditional formatting in Excel.
On the right-hand side of the screen you notice a slicer. This is a slicer on the "Severity level" column. This allows for easy filtering out the ERROR lines.
In this table (ListObject) you see a maximum of 30 records. In addition, I formatted the timestamp of the action. You can compare it to the output from the message log that is printed now:
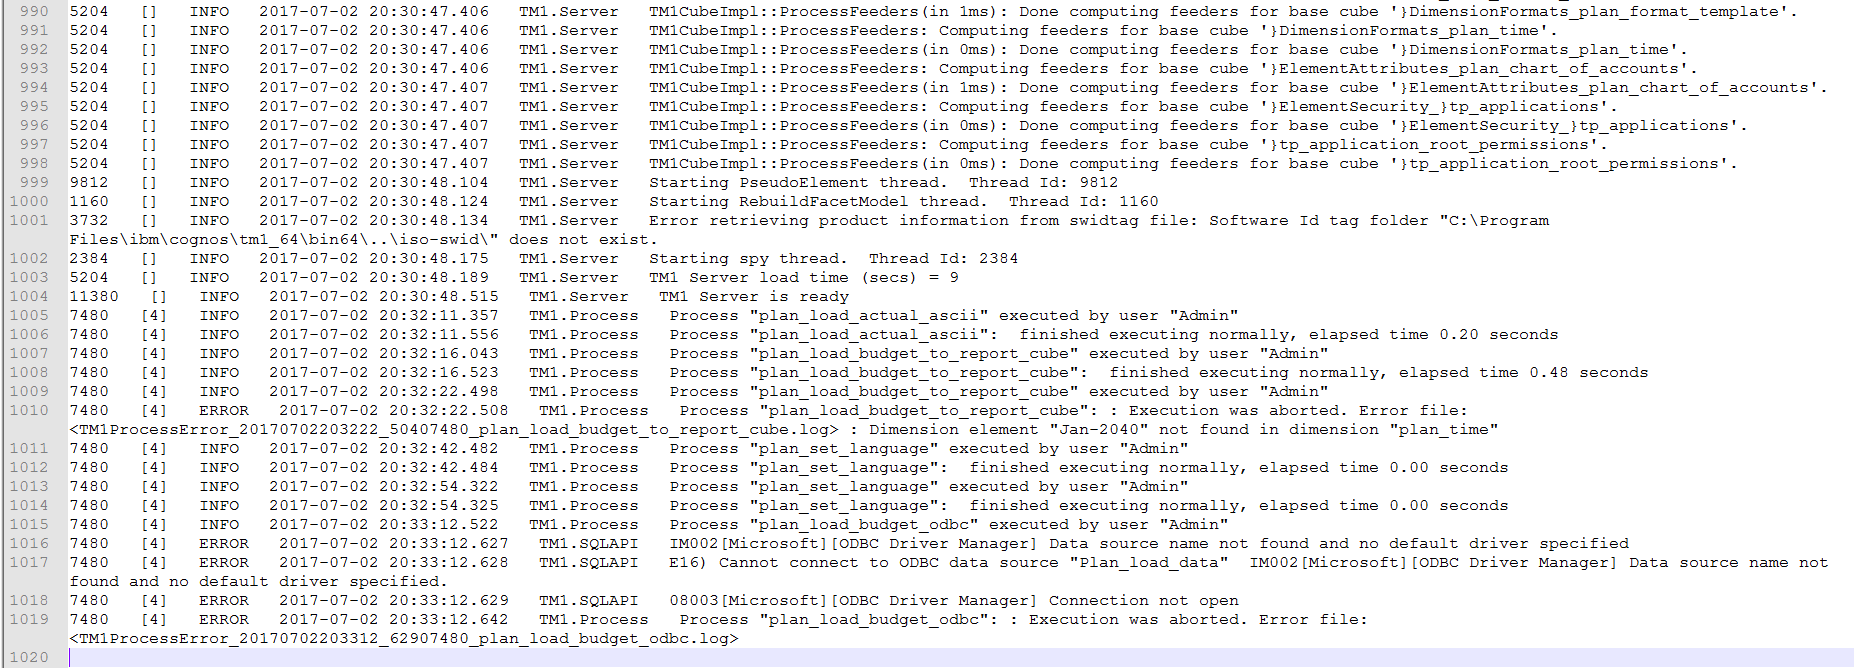
Not only the offset of 2 hours is taken care off, the format of the timestamp is more friendly in my Excel application. In fact, a number of settings can be specified in the first tab of the Excel file:

The user specifies:
- the path of the TM1 server log file
- how many records to show
- the time offset in hours
- the formtting for the timestamp
- a word / string to be highlighted in the message log output in the table
Regarding the last option: you could highlight all instances where the text "plan_load_budget_to_report_cube" is found i yellow (it's the name of a TI process):

The durations of TI processes
It's also worth looking at the duration of the different TI processes in a TM1 server. Here it is lightning fast but real TM1 models will show other times ;-) A second table in the Excel application lists the processes and their run times as well as when they ran:

Data analysis with Power Query
I will show you now a series of screenshots on how to set this up. Start from a blank Excel file with Excel 2013 (Power Query is an add-in) or Excel 2016 (Power Query is built-in). Head over to the Data tab to the Group called Get & Transform Data.
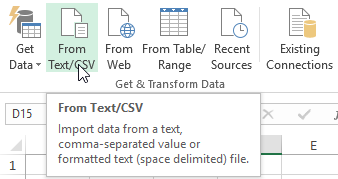
Browse to the file C:\Program Files\ibm\cognos\tm1_64\samples\tm1\PlanSamp\tm1server.log or any tm1server.log file. They should all have a similar columnar structure.
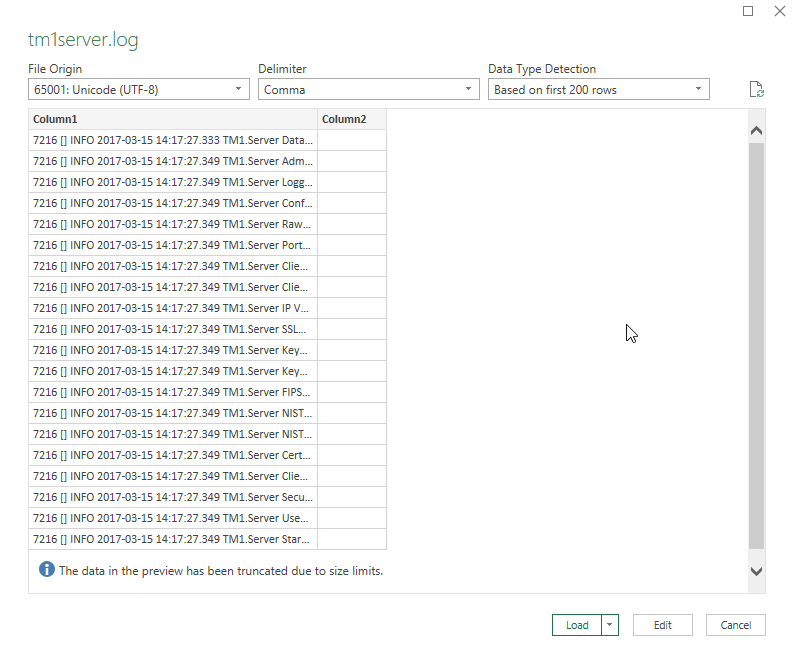
Choose Edit. Use as the Custom delimiter 3 spaces.
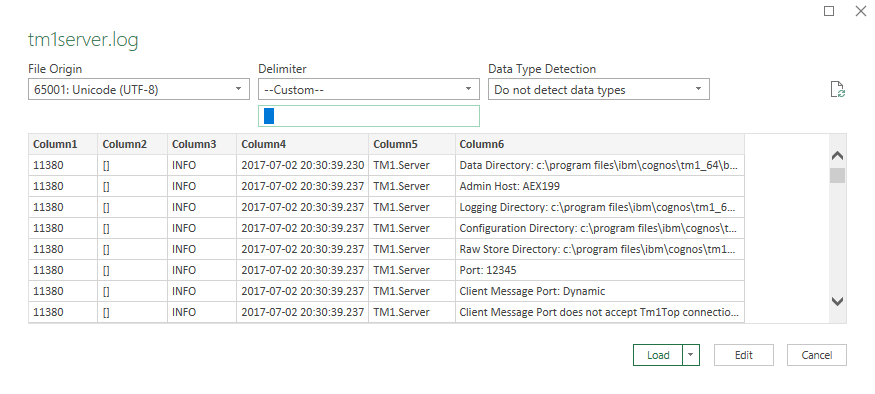
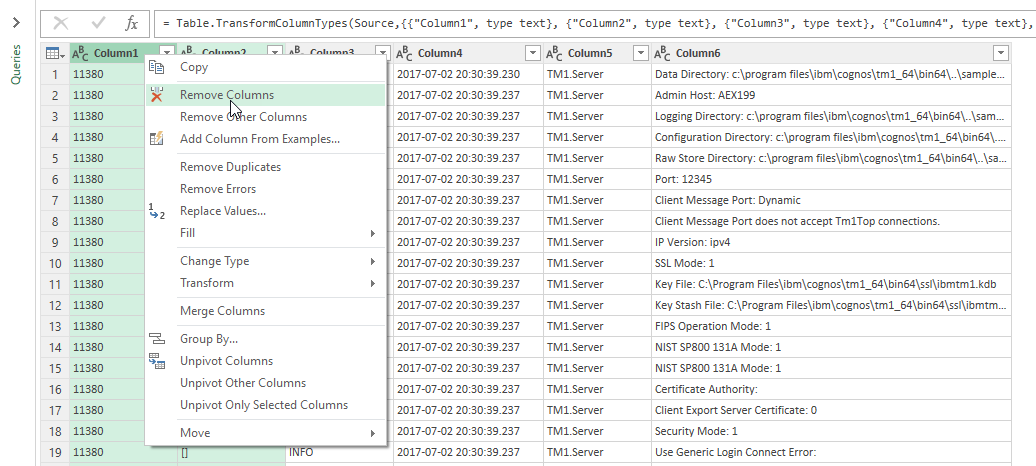
Choose Edit. Remove columns 1 and 2 by selecting their headers, and choose "Remove Columns" from the context menu:
Rename the remaining columns as follows (again from the same context menu, or a double-click on the header name will do as well):
- Column3 ==> Severity level
- Column4 ==> Timestamp
- Column5 ==> Logger Name
- Column6 ==> Message Text
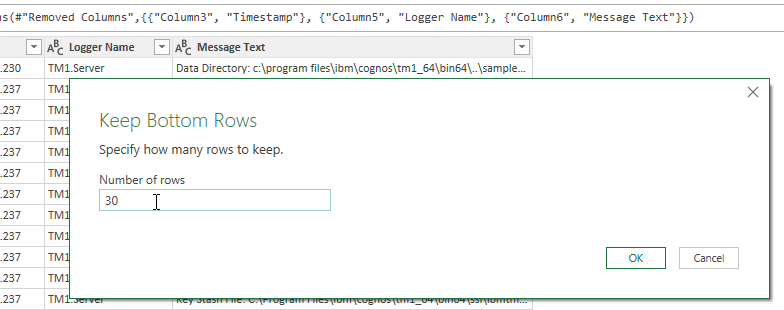
Keep the last 30 rows of the message log, which is in fact the 30 most recent records:
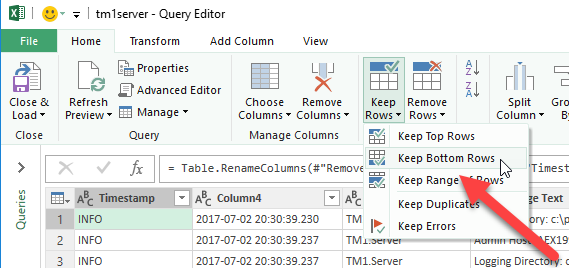
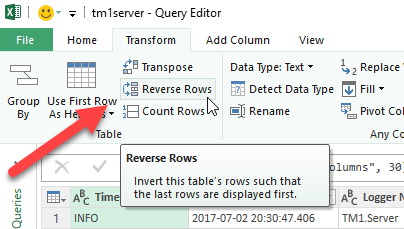
Very important, reverse the records. The last record in the message log contains the most recent activity on the TM1 server:
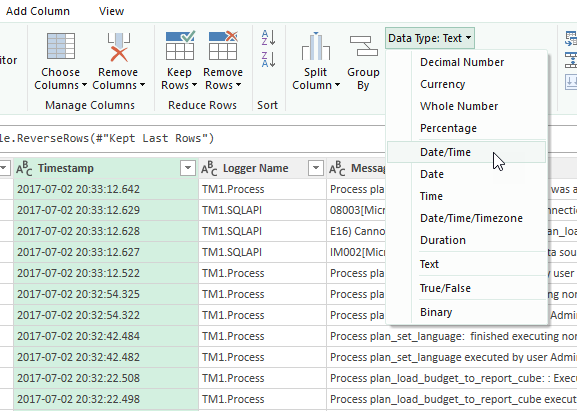
The last manipulation is to change the data type of the timestamp to type datetime:
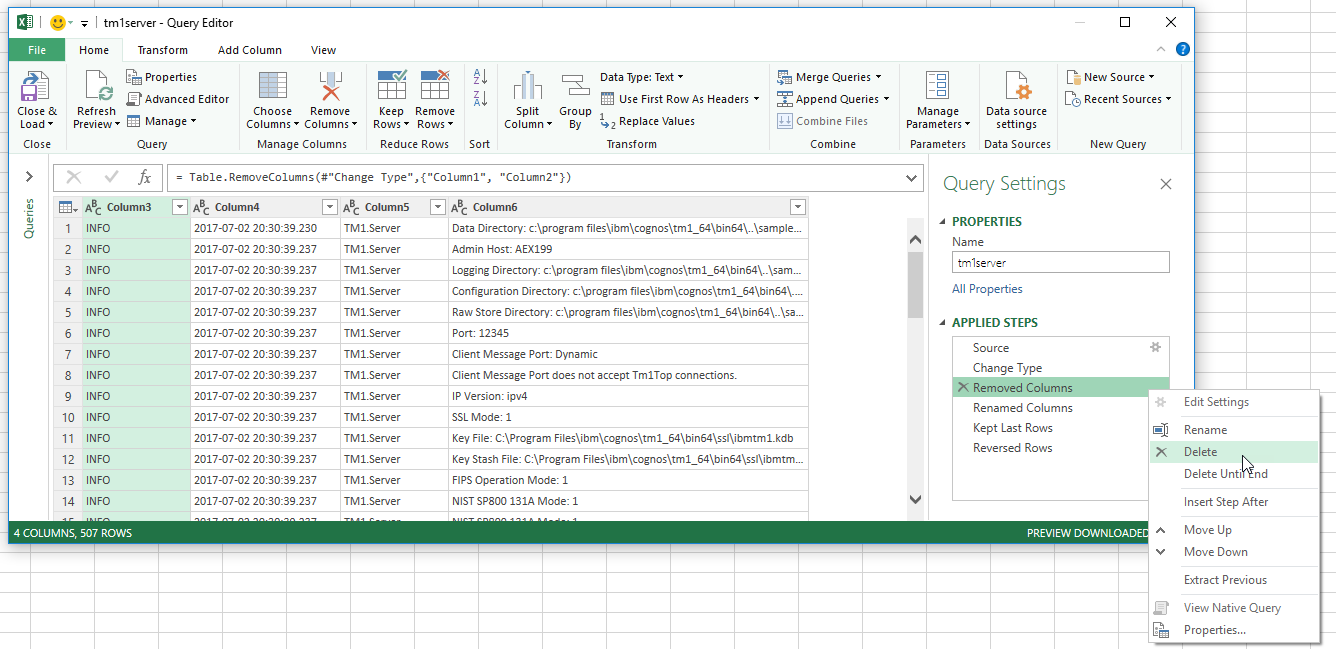
Well done, you finished the steps ! You can follow up on your steps on the right-hand side of the screen (where you can also delete or reorder steps easily):
These reworked data should now be brought into Excel. Choose "Close and Load to...". You will want to use a Table:
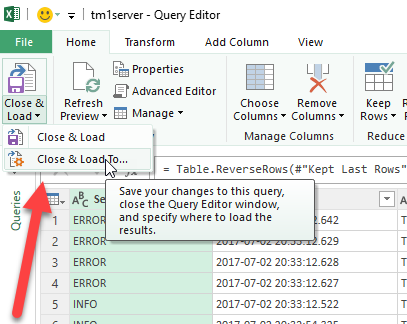
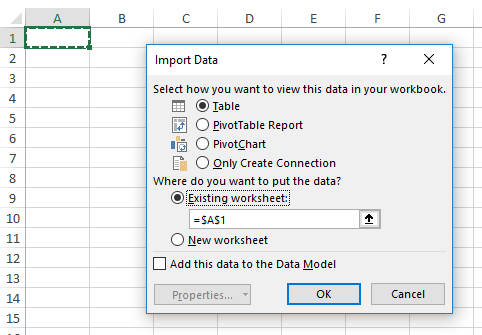
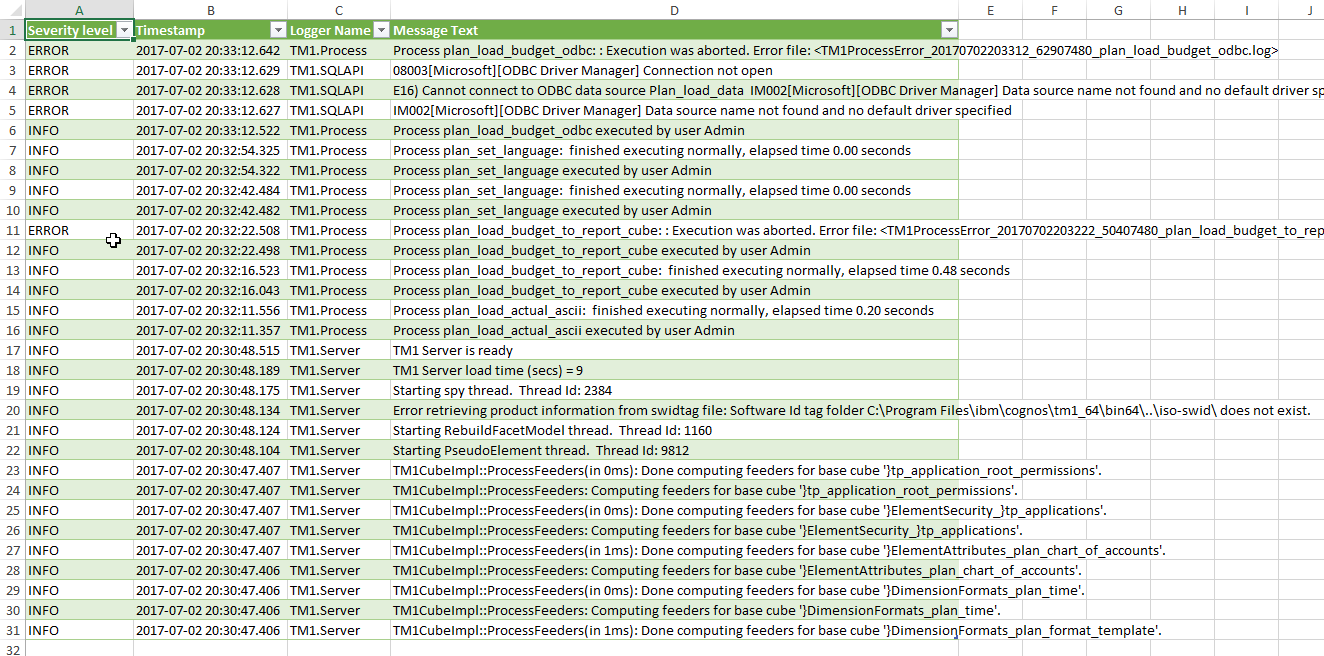
As of now, you are back in good old Excel. Your table is linked to the (server message log) text file. Every time the text file changes, you could refresh your Excel application, that is, your data table. At least make sure that the table is refreshed upon opening the file.
Add the conditional formatting (not depicted here) and also, fix the column widths to not change with every data refresh action. More importantly, add the calculated column in the Table for the formatted date time (I called the new column Timestamp_format and I hid the Timestamp column for the user):

You may notice the 2 hour offset that I add (2 divided by 24 hours a day) and then pay attention to the notation in the TEXT function. The logic is as follows: if the user fills in a custom format in the first sheet, I use it. If it is empty, I format the data always in a readable way. I show you an interesting way to format dates with "[$-x-sysdate]dddd, mmmm dd, yyyy". Regional dates are always a cause of frustration to me, I guess that with this notation everyone can have his/her own localized names.
What then remains is bringing in the named ranges instead of hardcoded values (like the filepath, the 30 records, etc.) I ended up with the following M code:
let
    Source = Csv.Document(File.Contents(Excel.CurrentWorkbook(){[Name="inpMessageLogFullName"]}[Content]{0}[Column1]),6,"   ",null,65001),
    #"Removed Columns" = Table.RemoveColumns(Source,{"Column1", "Column2"}),
    #"Renamed Columns" = Table.RenameColumns(#"Removed Columns",{{"Column3", "Severity level"}, {"Column4", "Timestamp"}, {"Column5", "Logger Name"}, {"Column6", "Message Text"}}),
    #"Kept First Rows" = Table.LastN(#"Renamed Columns",Excel.CurrentWorkbook(){[Name="inpMostRecentRecordsToRetain"]}[Content]{0}[Column1]),
    #"Reversed Rows" = Table.ReverseRows(#"Kept First Rows"),
    #"Changed Type" = Table.TransformColumnTypes(#"Reversed Rows",{{"Timestamp", type datetime}})
in
    #"Changed Type"
Process durations
In the text above, I referred to the 3rd tab of the file:

I leave it up to the user to set up this table using Power Query. This is a good exercise to explore the possibilities of data manipulation with Power Query. Among other things, you will need to filter a column for some values. Power Query (in fact, the M code) will remember these values and apply them next time you refresh the table. If you want you can use the first table as the source for the second table, instead of the tm1server log text file.
Interesting stuff ! Let me know what you think of it.
